Excel Mastery: Best Excel and Data Analytics Courses for Business Professionals
Excel remains the cornerstone tool for data analysis across industries, from finance to marketing. These comprehensive courses transform beginners into advanced analysts, teaching powerful functions, data visualization, automation, and AI-driven analytics that drive business decisions and career advancement.
Master VLOOKUP, XLOOKUP, INDEX-MATCH, IF statements, SUMIF, COUNTIF, and nested logical functions. Learn to search, match, and analyze data efficiently, create dynamic calculations, handle errors gracefully, and build complex formulas that automate decision-making processes for sophisticated business analysis and reporting.
Build professional interactive dashboards using Power Query, Power Pivot, dynamic charts, filters, and slicers. Transform complex datasets into simple, visually impactful presentations with charts and graphs that communicate insights clearly to stakeholders, executives, and teams, making data-driven storytelling accessible and compelling.
Python Integration for Advanced Analytics
Combine Excel with Python programming using NumPy, Pandas, Matplotlib, and Seaborn for sophisticated data manipulation and analysis. Learn data collection, preprocessing, cleaning, memory optimization, statistical analysis, hypothesis testing, regression modeling, and Monte Carlo simulation for comprehensive analytical capabilities beyond Excel’s native functionality.
PivotTables and Business Intelligence
Master one of Excel’s most powerful tools for summarizing, analyzing, and exploring data. Create pivot charts, perform multi-dimensional analysis, aggregate information from large datasets, identify trends and patterns, and generate dynamic reports that update automatically as underlying data changes for real-time business intelligence.
Automation with Macros and AI Tools
Save hours automating repetitive tasks by recording macros and understanding VBA code. Leverage cutting-edge AI features including Excel Copilot, Analyze Data, and Smart Lookup to accelerate analysis workflows, generate insights faster, make smarter decisions, and enhance productivity with intelligent automation that adapts to your needs.
Power Query and Power Pivot for Big Data Management
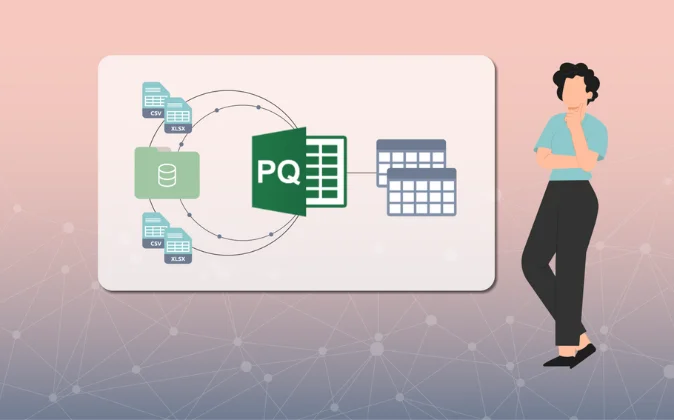
Handling large datasets efficiently requires tools beyond standard Excel functions. Power Query transforms how you import, clean, and shape data from multiple sources, while Power Pivot enables advanced data modeling with relationships, calculated columns, and DAX formulas. Together, these tools let you work seamlessly with millions of rows, create sophisticated data models, and build enterprise-level reports without performance issues or complex manual processes.
Microsoft Excel-Beginner to Advanced with Data Analysis & AI
Ultimate Excel training from basic operations to advanced AI-driven analytics. Master VLOOKUP, XLOOKUP, INDEX-MATCH, IF functions, create three professional dashboards using Power Query and Power Pivot, visualize data with impactful charts, work with big data, automate with macros, harness Excel Copilot and AI features for finance, business, marketing, and analytics.
Complete Data Analyst Bootcamp From Basics To Advanced
Comprehensive training covering Python, statistics, generative AI, EDA, AWS, SQL, Excel, Power BI, Tableau, ETL, Snowflake, and feature engineering. Master Pandas, NumPy, Matplotlib, Seaborn, SQL Server database management, exploratory data analysis, interactive dashboards with Power BI, DAX calculations, and real-world data integration for complete analyst proficiency.
The Data Analyst Course: Complete Data Analyst Bootcamp
Complete preparation for data analyst roles covering Python programming, NumPy, Pandas, data collection, preprocessing, cleaning, visualization, and analysis. Acquire big-picture understanding of analyst responsibilities, learn beginner and advanced Python, study mathematics fundamentals, work with text files, understand data types and memory usage for efficient processing.
Comprehensive analytics using tools you already have—15 hours of training covering data visualization, hypothesis testing, statistics, forecasting, regression analysis, Monte Carlo simulation, linear programming, pivot tables, and business intelligence. Includes 42 downloadable resources, mobile access, and completion certificate for demonstrating Excel analytics expertise.
Progress from zero to hero with advanced Excel skills for your resume. Master dashboard reporting with expert tips, advanced scenarios, data analysis, pivot tables, modern Excel with DAX and Power Query, unlock dynamic formulas using IF, VLOOKUP, INDEX, MATCH functions, and create dynamic reports impressing bosses with professional analytical capabilities.
Data Analytics Masterclass: Excel, Python, PowerBI & ChatGPT
Master Excel, Python, Power BI, and ChatGPT to launch your data analyst career. Learn advanced data analysis, predictive modeling, visualization, and machine learning. Gain hands-on skills in PivotTables, dashboards, Python data manipulation, and Power BI reporting, while leveraging ChatGPT for smarter, faster analytics and insights.
“The AI-integrated Excel course revolutionized my workflow completely. Excel Copilot and Power Query reduced my monthly reporting time from three days to six hours. My manager promoted me to senior analyst within four months based on the efficiency improvements and advanced dashboard capabilities I demonstrated.”
Linda Martinez
Business Intelligence Specialist
“Combining Excel with Python opened entirely new analytical possibilities for my organization. Building sophisticated models with Pandas and visualizing results in Excel dashboards gave me skills that made me indispensable. Received 30% salary increase after implementing automated forecasting systems saving our team countless hours weekly.”
Rajiv Sharma
Data Analyst
“Started as Excel beginner, now I’m training colleagues on advanced analytics and dashboard creation. The comprehensive bootcamp covering Python, SQL, Power BI, and Tableau made me a complete analyst. Transitioned from operations to dedicated analytics role with significantly better compensation and career growth opportunities.”